P-Value Is Not Probability Of Getting the Data Assuming Null Hypothesis Is True
Sections
This is a very short article containing a simple example that shows how the p-value is not “the probability of getting the data assuming that the null hypothesis is true”.
The phrase in quotation marks is missing just a little bit more. The correct version should be “the probability of getting the data, or something more extreme, assuming that the null hypothesis is true”.
“More extreme” means further away from the mean of the null hypothesis distribution.
Testing a Coin for Fairness
Our simple example is a coin with probability \( p \) of landing on heads when tossed. Suppose we flipped it \( n = 10 \) times and get \( h = 5 \) heads. We want to test the null hypothesis that \( p = 0.5 \).
Strictly speaking, we should be using the sample mean \( \overline{x} = \frac{}{} \) to do this hypothesis testing. This sample mean has a sampling distribution, which is used to calculate the p-value. To avoid overcomplicating this article, we will just work with the binomial distribution directly.
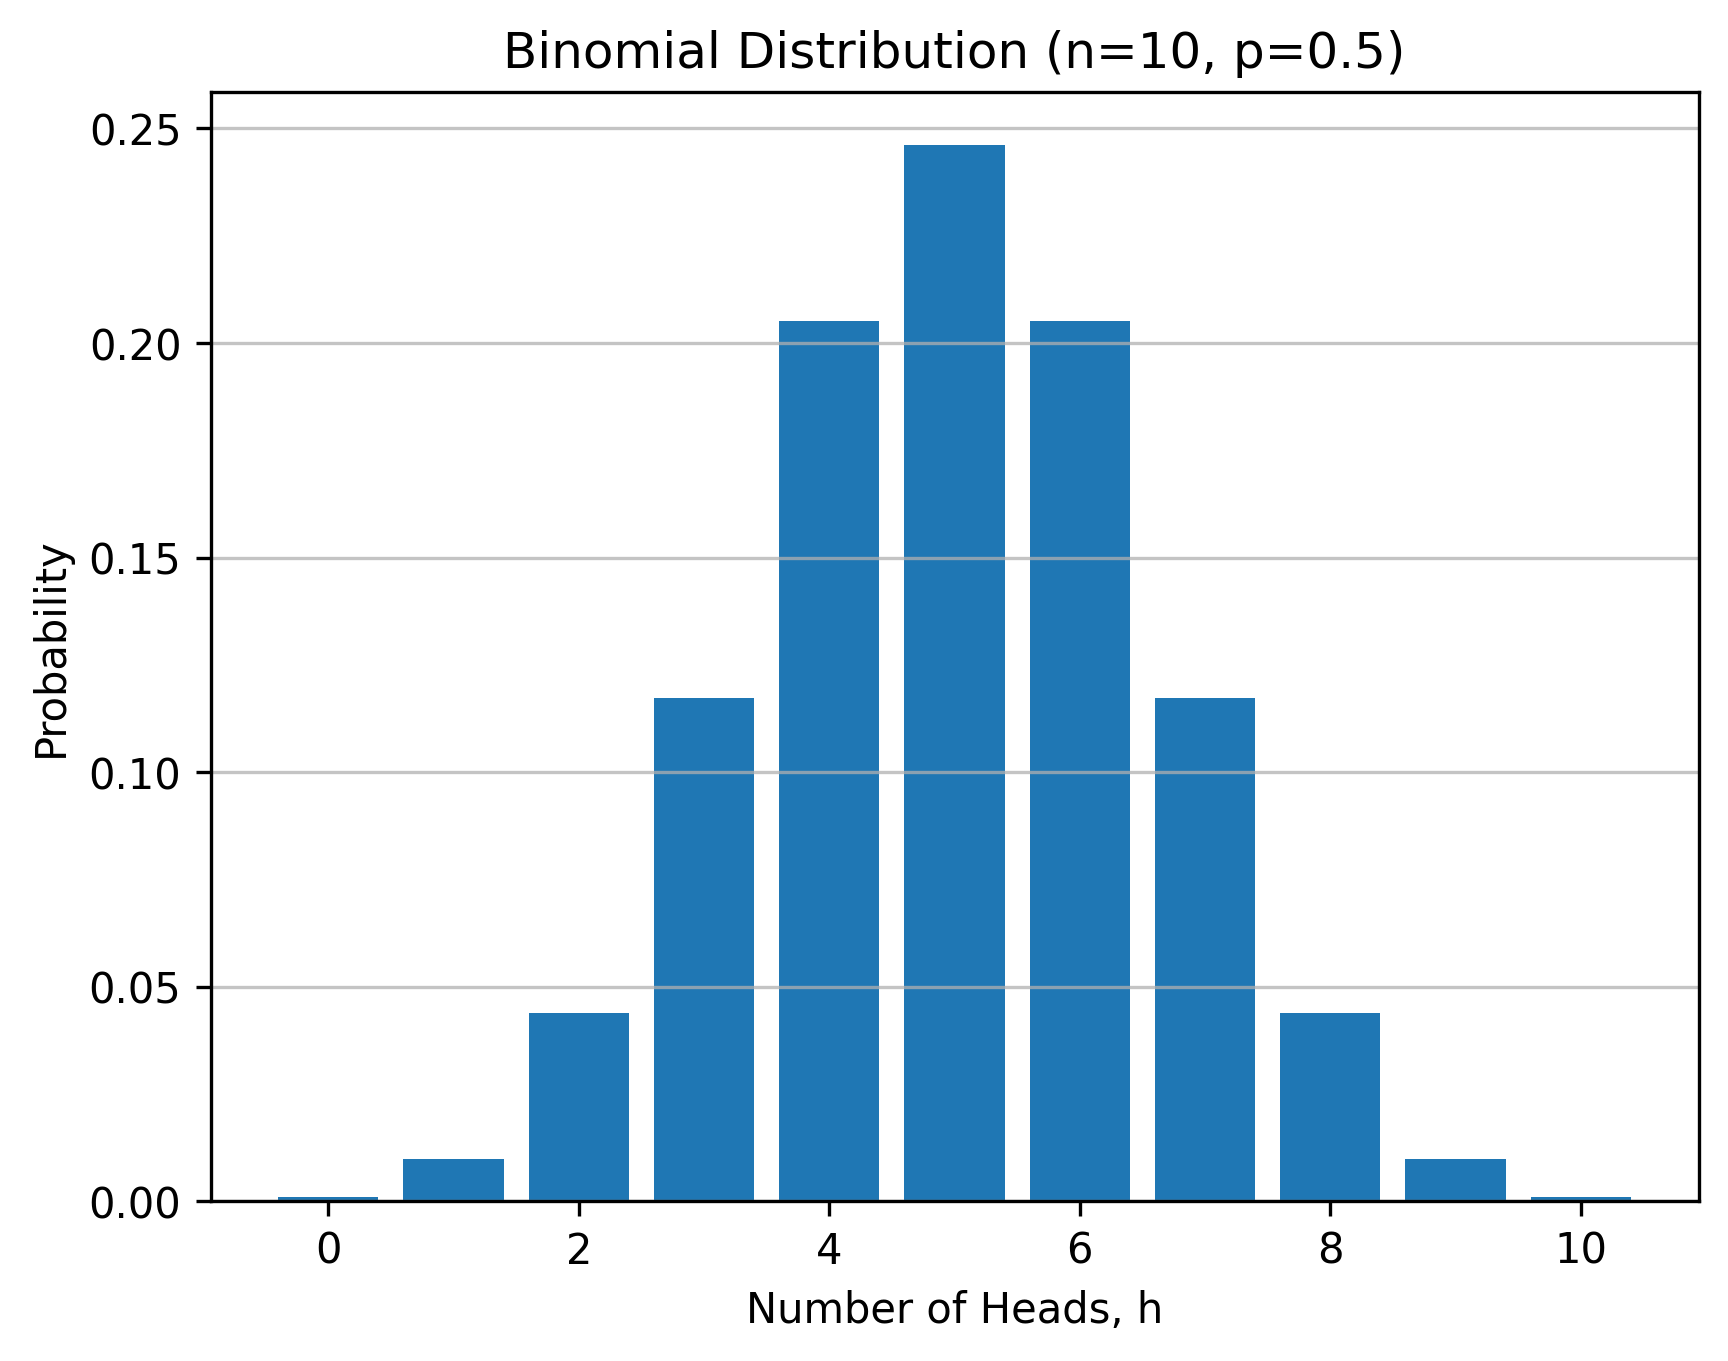
Assuming that the null hypothesis of \( p = 0.5 \) is true, the number of heads in \( n = 10 \) trials have the binomial distribution with parameters \( n \) and \( p \). This distribution is plotted in the figure below.
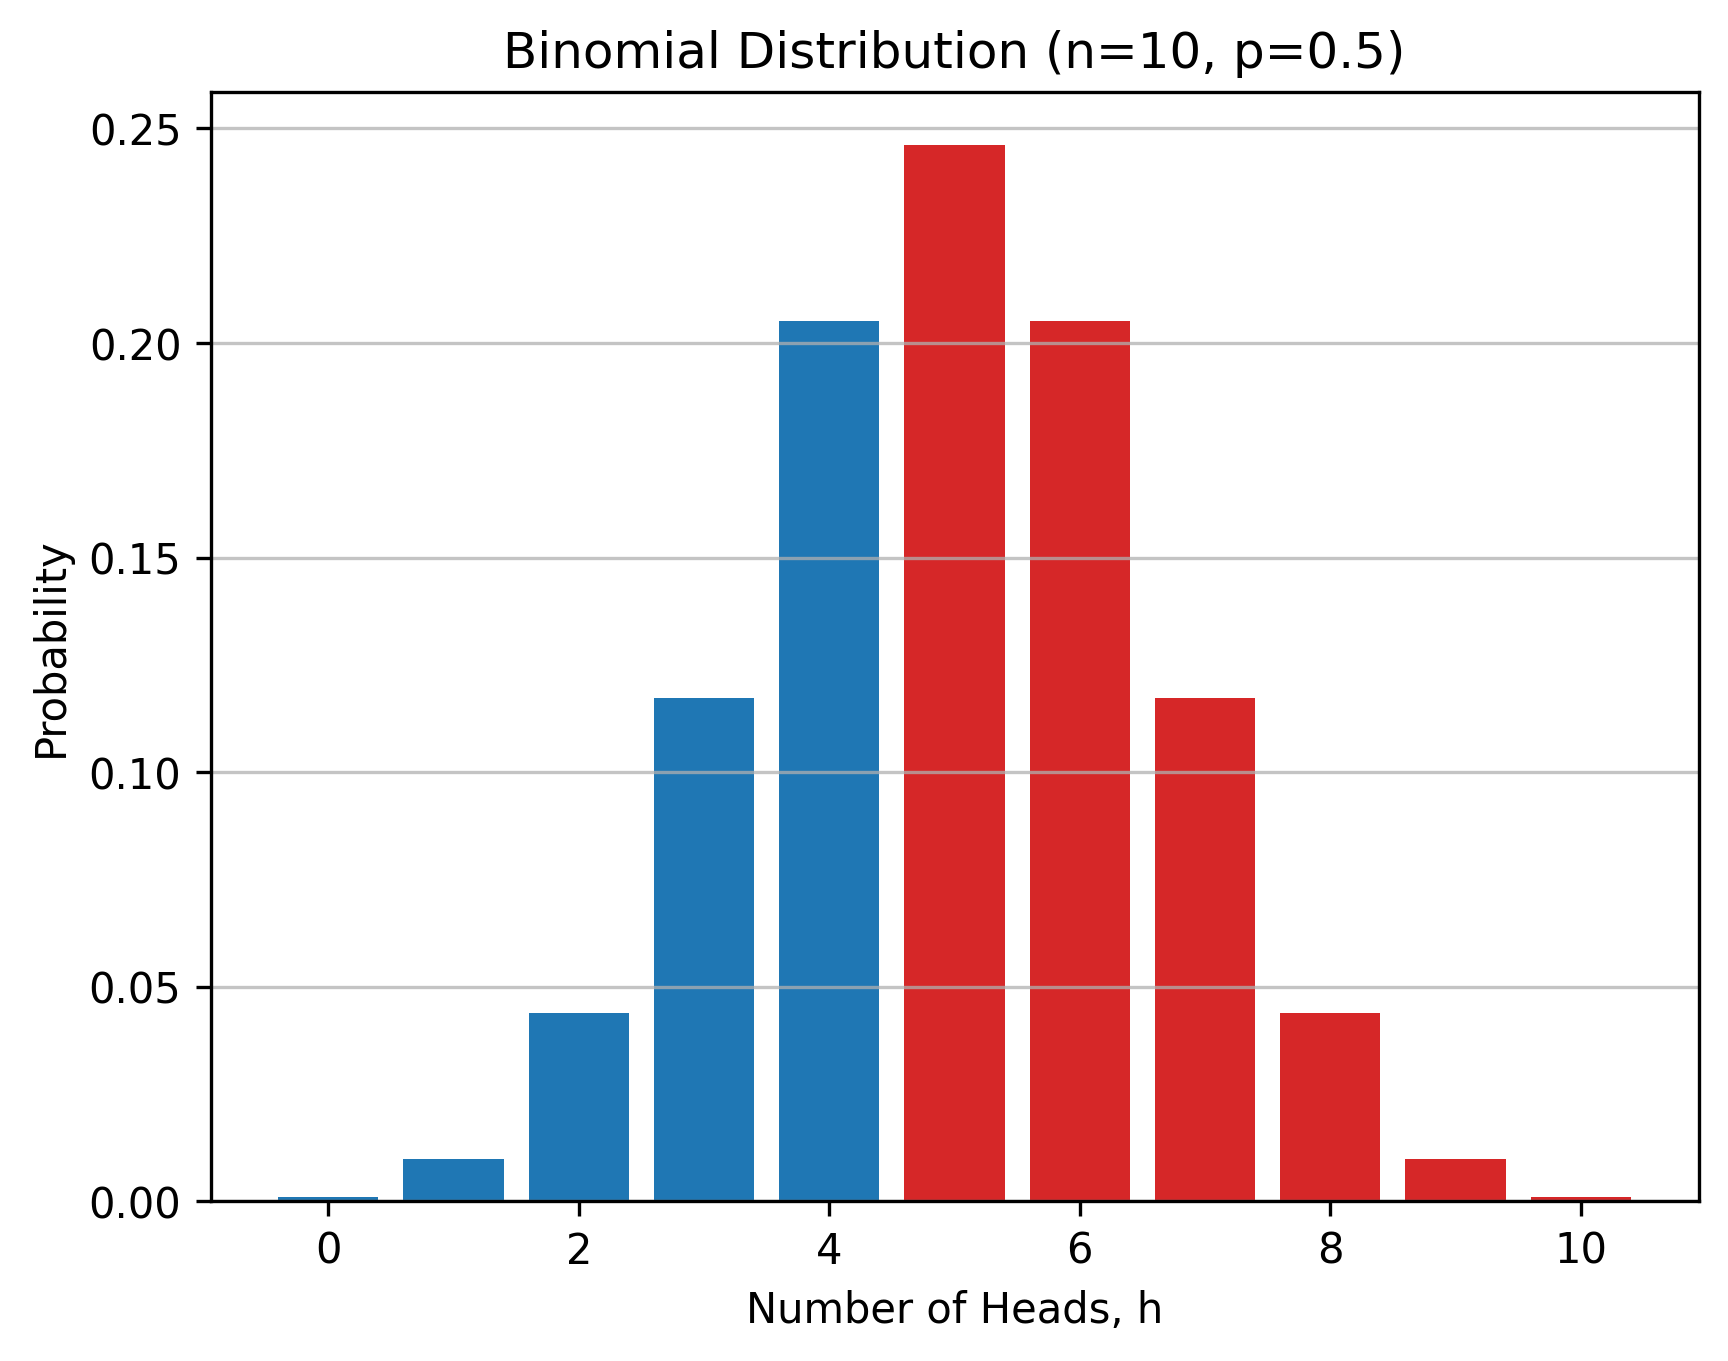
The figure below shows the p-value using the area colored red, which is \( 0.623 \). This is the probability of getting five or more heads, \( h \geq 5 \), in \( n = 10 \) flips of the coin. It is also the probabibility of getting our data of \( h = 5 \) or something more extreme \( h > 5 \).
We can easily calculate the probability of getting our data. In our data, we got exactly \( h = 5 \) heads in \( n = 10 \) flips. The probability of this happening is \( 0.246 \).
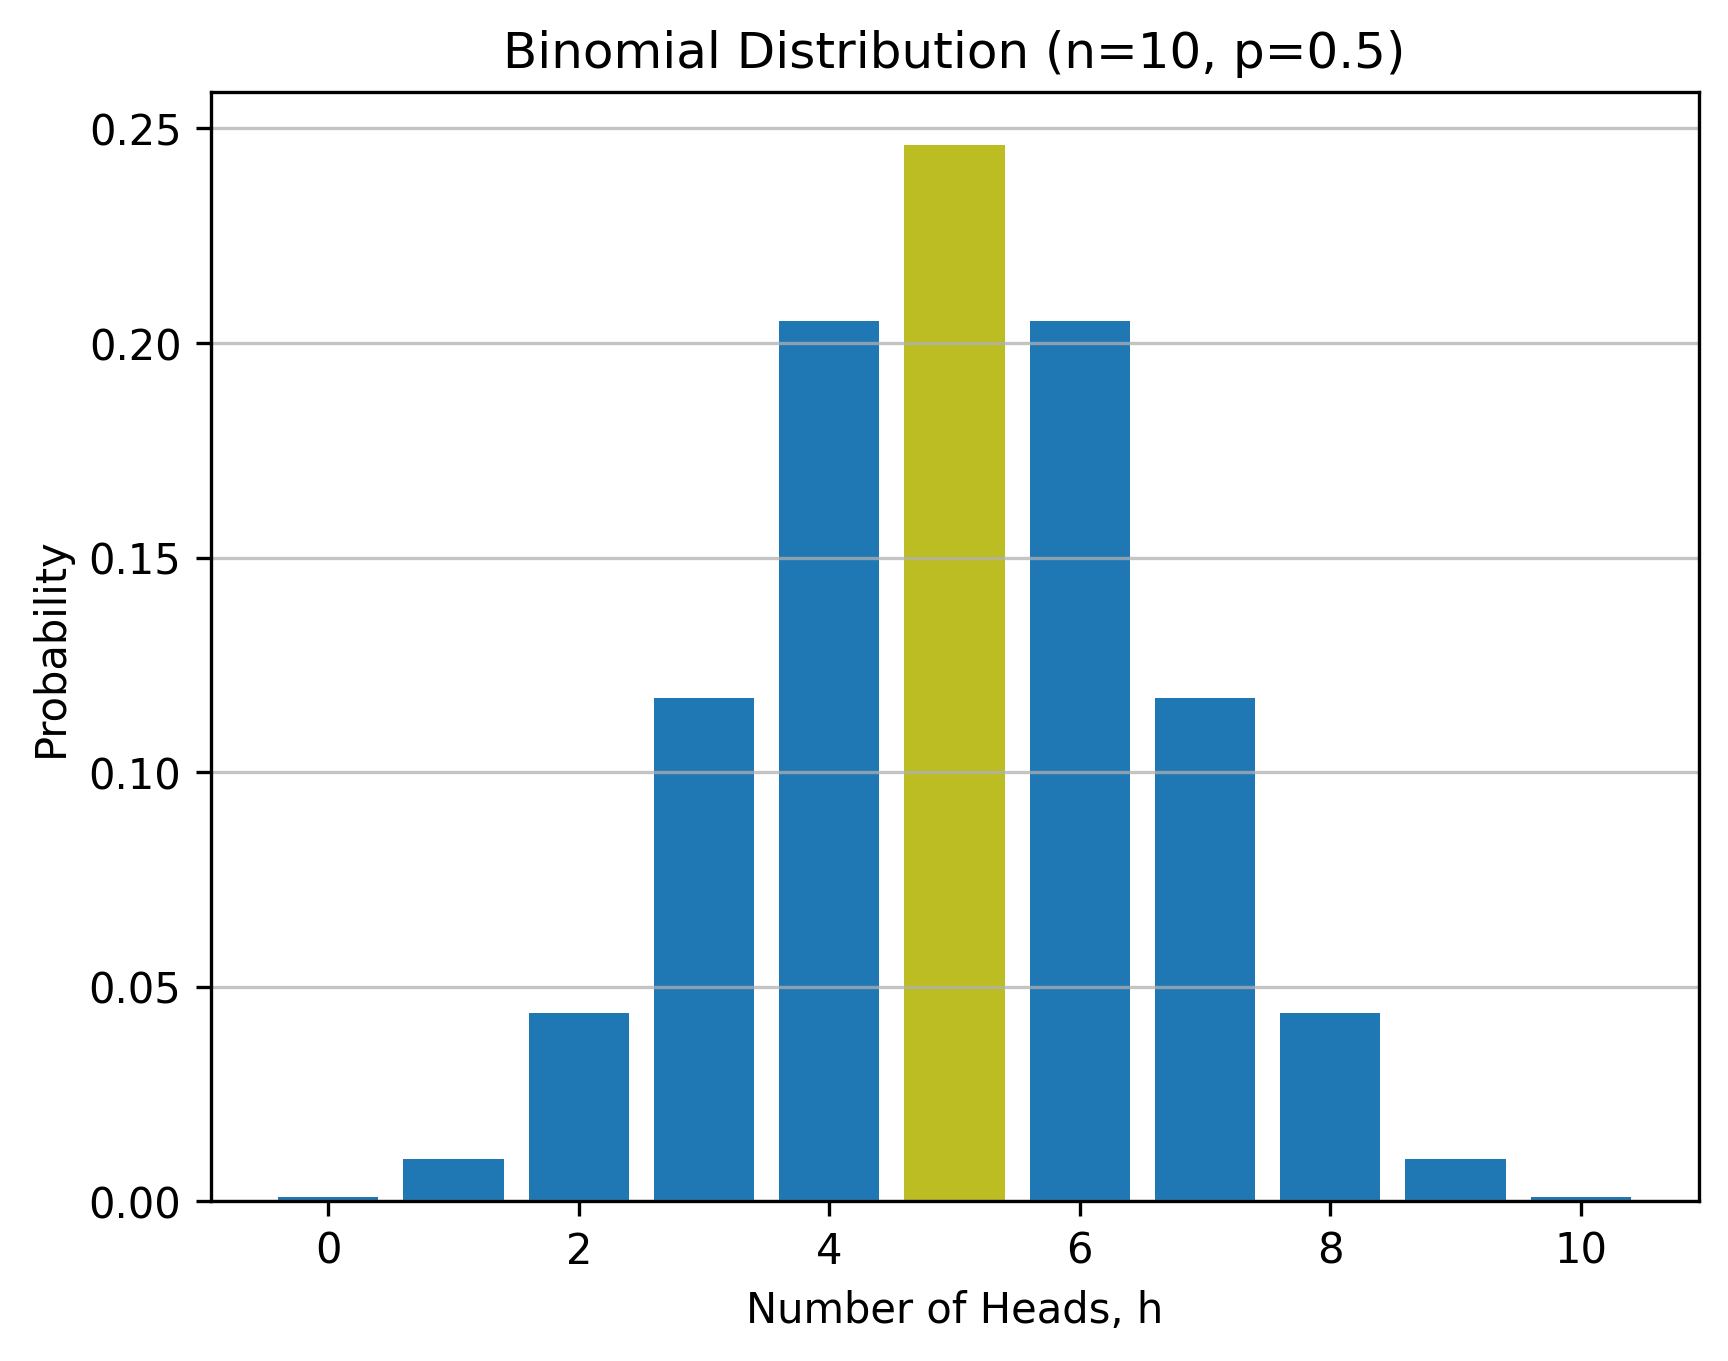
The area colored yellow in the figure above is the probability of getting our data. The p-value \( 0.623 \) is not the probability \( 0.246 \) of getting our data, assuming that the null hypothesis is true.
Why Not Use the Probability of Getting the Data?
Why do we not use the probability of getting the data, given that the null hypothesis is true? The answer is simple: for continuous distributions, the probability of getting our data is always zero!
Here is a concrete example: suppose you sample a point from the standard normal distribution and the point turns out to be \( x = 1 \).
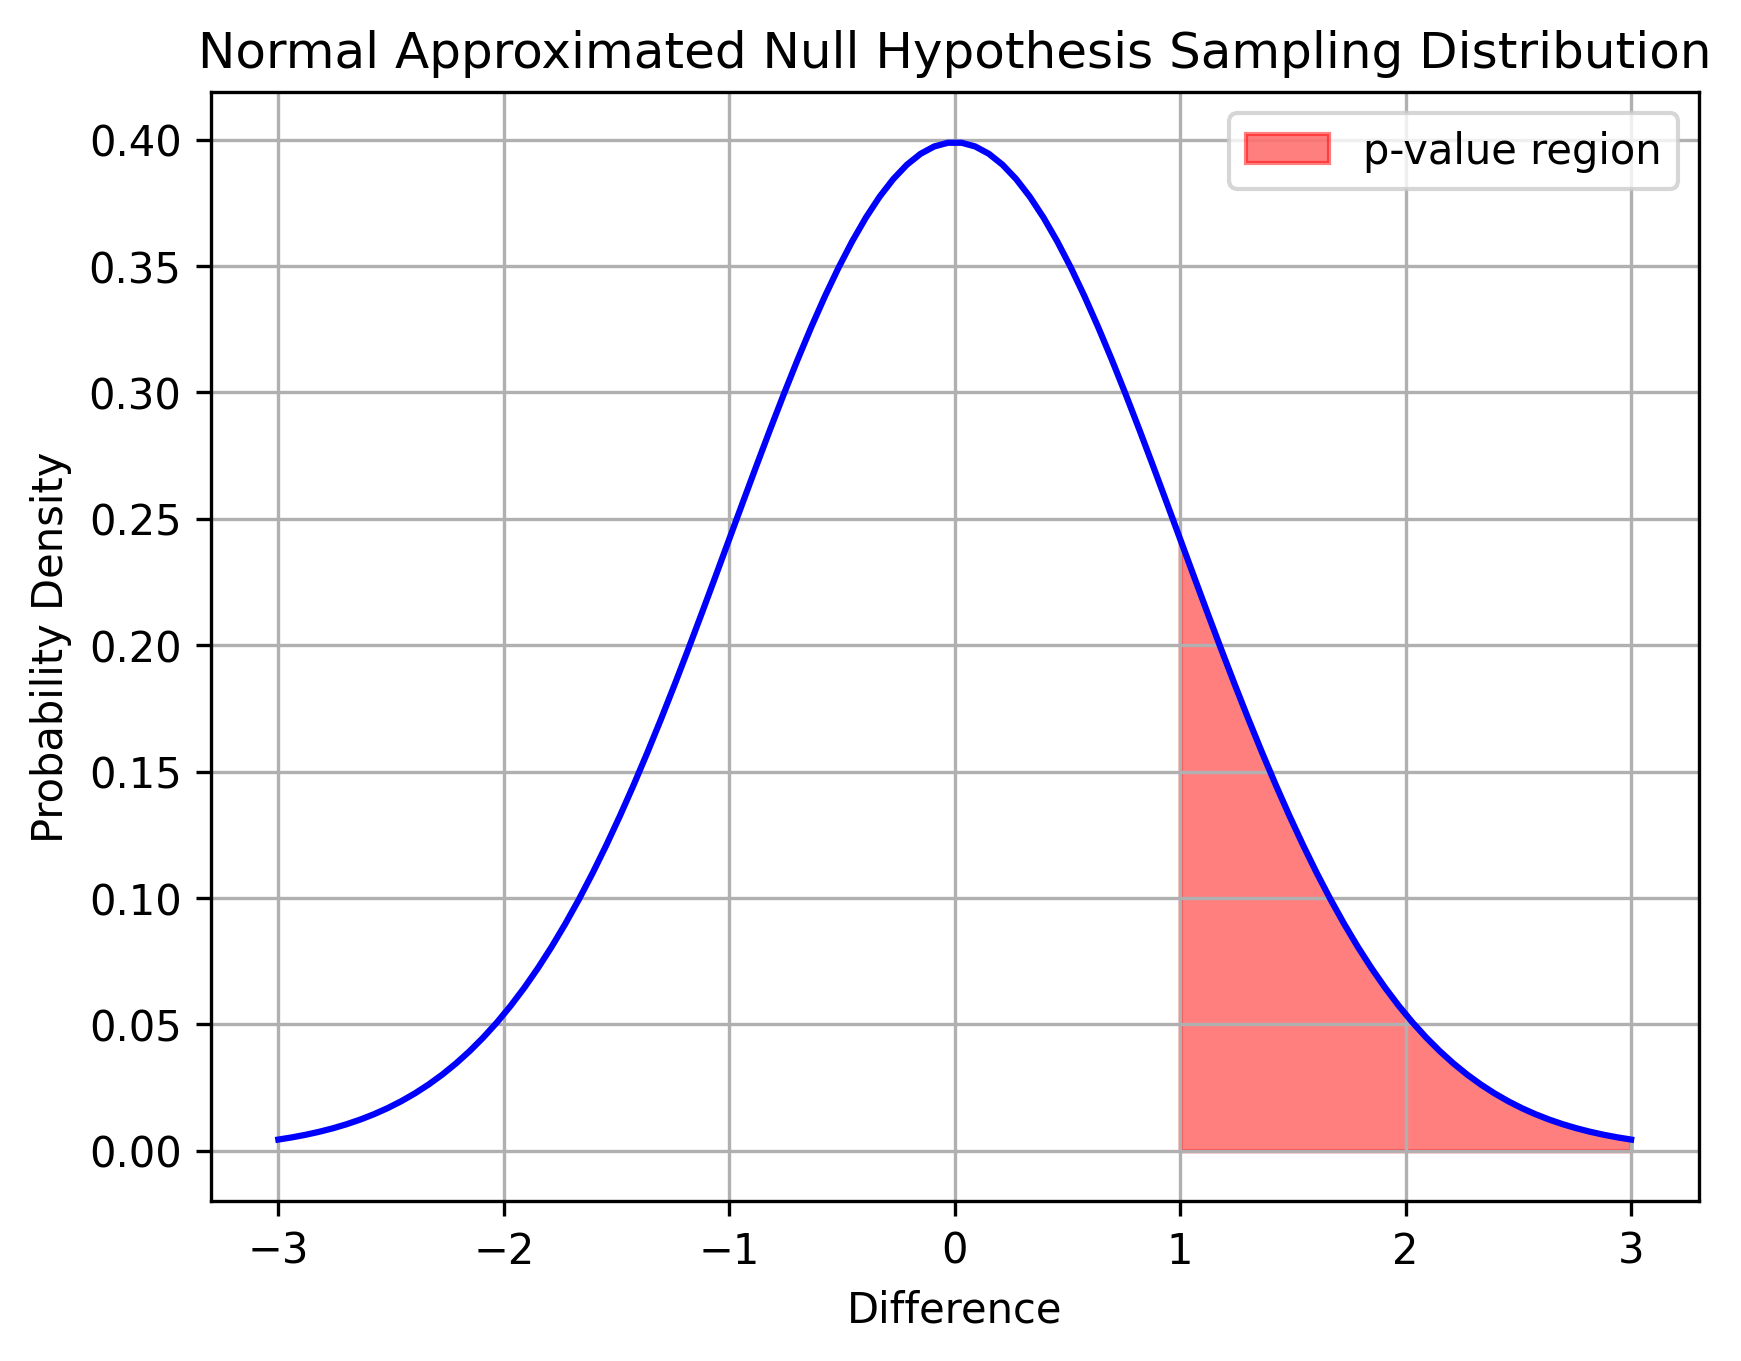
We can say that the probability of getting \( x \geq 1 \) is \( 0 \). This area is colored red in the figure above. But the probability of getting exactly \( x = 1 \) is zero because the standard normal distribution is continuous!
Another way of thinking about this is that, for a continuous distribution, there are infinite values that \( x \) can take. So, the probability of each individual point must be zero for all the probabilities to sum up to \( 1 \).